What's this?
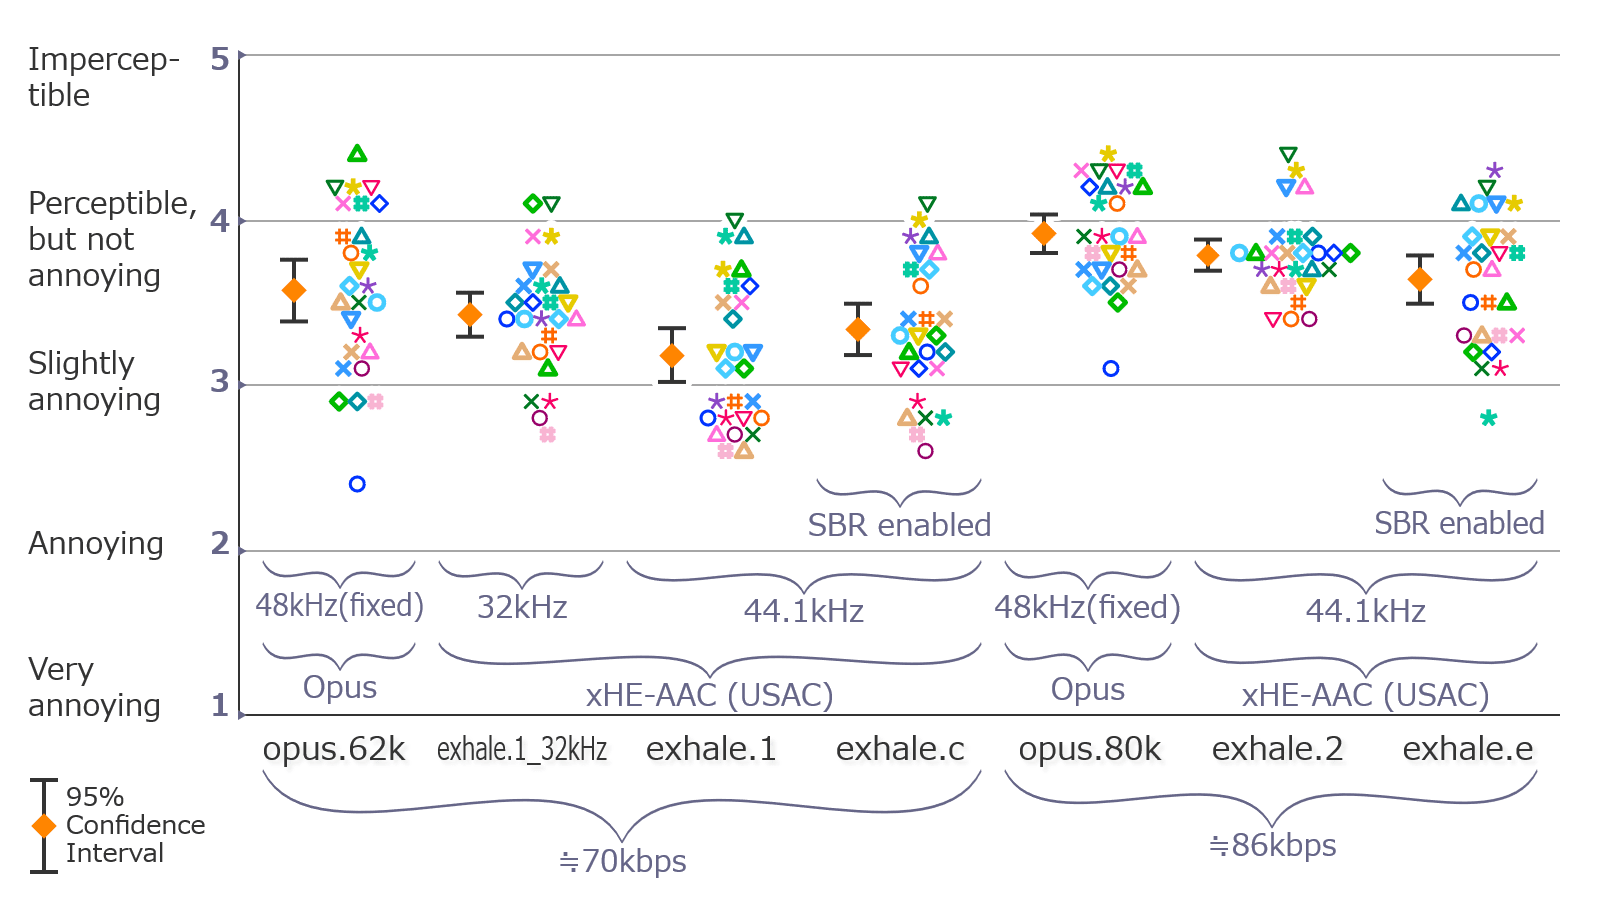
An online dot plot maker, dedicated to visualize the ABC/HR test results.
Why did you create it?
There are many results of public and private listening tests on the web. However, there was once a time, the only visualization and graphs attached to the results were "dynamite plots".
In the past listening tests, their visualization efforts were used to be poor, probably because testers were exhausted after listening tests.
I created this software so that we can visualize the results in minimal time and efforts.
Now this is the standard software to visualize the ABC/HR test results.
Is there an example input format?
% Totally fake score
encoderA	encoderB	encoderC
5	5	4.5
2.2	3	3.6
4	3.1	3
5	4.4	4.2
2.5	1.9	1.6
opus v0.9.9	aoTuV b6.03	aoTuV b5.7	qaac tvbr
%features	8	Opus	Ogg Vorbis	Ogg Vorbis	AAC-LC
2.850	3.000	3.100	2.550
2.900	3.250	3.150	3.050
2.800	2.850	3.000	3.450
%samples 41_30sec hihats
%samples finalfantasy strings
%samples Atrain Jazz
opus_75k celt_75k cvbr_75k opus100k celt100k cvbr100k
3.05 3.10 2.50 3.50 3.75 3.70
3.75 2.95 2.70 4.05 3.80 4.00
2.80 2.55 3.00 3.60 3.25 4.05
%features 6 75kbps 75kbps 75kbps 100kbps 100kbps 100kbps
%features 7 OPUS OPUS AAC-LC OPUS OPUS AAC-LC
% MP3 and AAC listening test.
Lame-CBR192k Numa-VBR
3 4
4 5
2 3
%bitrate
192000 189012
192000 210123
192000 123456
% AAC 96kbps ABC/HR score
qaac cvbr	encaacplus	nero abr
3,7	3,0	2,6
3,8	3,3	2,6
3,5	2,9	3,2
3,5	3,5	2,9
%samples	Tarentella
%samples	Minase sanchi
%samples	Miles Davis
%samples	58 Guitar
% You can use spaces if you use tabs as split marks.
% tabs and spaces can coexist.
Opus	FDK-AAC	exhale	LAME
%feature	10	--bitrate 39	-b:a 42k	a	-V 5
%feature	11	album:~40kbps	album:~43kbps	album:~40kbps	album:~131kbps
%y_axis	Bitrates of music tracks [kbps]
46.331	43.282	55.803	159.545
56.552	43.277	42.408	113.421
Is the format compatible with ff123's FRIEDMAN?
Yes. The incompatible part is that FRIEDMAN considers both spaces and tabs as split marks, and confuses the FRIEDMAN if the encoder names include spaces. In this program, only tabs will be recognized as a split mark when both of them are used, so you can use a name with spaces safely. (like "LAME 3.99 V2")
How can I post the crisp PNG Image (2x, high resolution) in Hydrogen Audio?
You can manually set the original width and height like this below. In that way, you can shrink the image into the width and height you've selected. This PNG is 1440px in width, but shown in 1/2 size.
[img width=720 height=420]https://listening-test.coresv.net/img2/23lc3-en2x.png[/img]There are two buttons. What's the difference?
"Make graph" produces slightly more accurate results at the cost of more time. Press the "Make graph" for the final outputs.
What algorithm is used to compute error bars?
CI95%, percentile bootstrap (N=10,000 for preview, N=200,000 for "Make graph", non-parametric; it doesn't assume normal distribution).
The error bars look asymmetric. Are they correct?
Yes, they can be asymmetric, as the bootstrap method is used to compute confidence intervals.
The error bars moves slightly as I change one of the settings or redraw the graph.
Yes, they move. The graph you get is not very accurate as it's a preview. Make sure you press "Make Graph" before you save the graph.
How can I save the graph?
| Version/Browser | Firefox | Chrome | IE11, 10, 9 | IE8, 7, 6 |
|---|---|---|---|---|
| graphmaker 6 | Right click | Right click | Unsupported | Unsupported |
| graphmaker 5 | Right click | Right click | Right click | PrintScreen |
| graphmaker 3 | Right click | Right click | Right click | PrintScreen |
| graphmaker 2 | Right click | PrintScreen | PrintScreen | Unsupported |
| graphmaker 1 | Right click | PrintScreen | PrintScreen | Unsupported |
Right click: Right click the graph/table you want to save, and save the image. This might not be possible in some Firefox enviroments.
PrintScreen: Press the PrintScreen key and paste the image to somewhere else.
Unsupported: You can't make the graph/table.
I cannot save the graph in Firefox. I can see the right-click menu "Save image as..." but nothing happens.
I'm aware of the issue. Please use PrintScreen key in that case.
The graph does not extend past 4096px height in iOS, including in iPad.
Mobile Safari 9+ might limit the total Canvas size 4,096 x 4,096 pixels. Please use other environment in that case.
It does not work with Safari, iOS 10.
Please press the "Make Graph" button each time you change the setting. It should work.
The open font, Noto Sans Japanese, Open Sans Condensed, Open Sans, and Source Sans Pro won't load.
Please press the "Make Graph" button twice in that case.
The open font will not work with SVG if the SVG is encapsulated, such as in an <img> tag, or opened in a stand-alone fashion.
Using SVG with Google Font is hard, but you can embed the whole SVG code into an HTML file.
It does not work with Microsoft Internet Explorer 11.
The support for the Internet Explorer 11 has been omitted in the graphmaker 6, sorry. It won't work on Opera Mini. Firefox (95 or later) is the most recommended browser.
It doesn't work. The graph is collapsed.
Use the newest graphmaker 6. It should work. (Hydrogenaudio board automatically converts tabs into multiple spaces, and it was causing problems.)
Will this program send my data on the server?
No. Your data will be processed inside your browser. It won't submit the data on anywhere else. However, if you use any of the Google Fonts (Open Sans, Open Sans Condensed, Source Sans Pro, Noto Sans JP), requests for required glyphs will be carried out.
I want to use a similar visualization, using other software.
Search "beeswarm" or "dot plot".
I want to save the graphmaker 6.
Please save these components by right-clicking the link. Graphmaker 6 and Canvas2Svg and the main Javascript engine.
Are there any future development plan?
Yes, as of April 2025, I'm planning to add multilevel visualization as well (that's what many users are manually doing at this moment).
Opinion/bug report?
Contact me via twitter (@kamedo2) or hydrogenaudio.